Provectus
A data-driven platform to illuminate the intelligence of nature
Overview
Provectus is a digital platform to automate biological research and help develop a radical alternative to production systems by utilising the photosynthetic power of micro-algae.
Contributions
Working with a small team of technicians and molecular biologists over 6 months in 2020, I worked as the sole product designer involved in helping build the additional functionality needed for the lab to conduct scientific research through the new software solution. Before joining, a basic interface existed to send simple commands to the devices as a proof of concept without any data being captured.
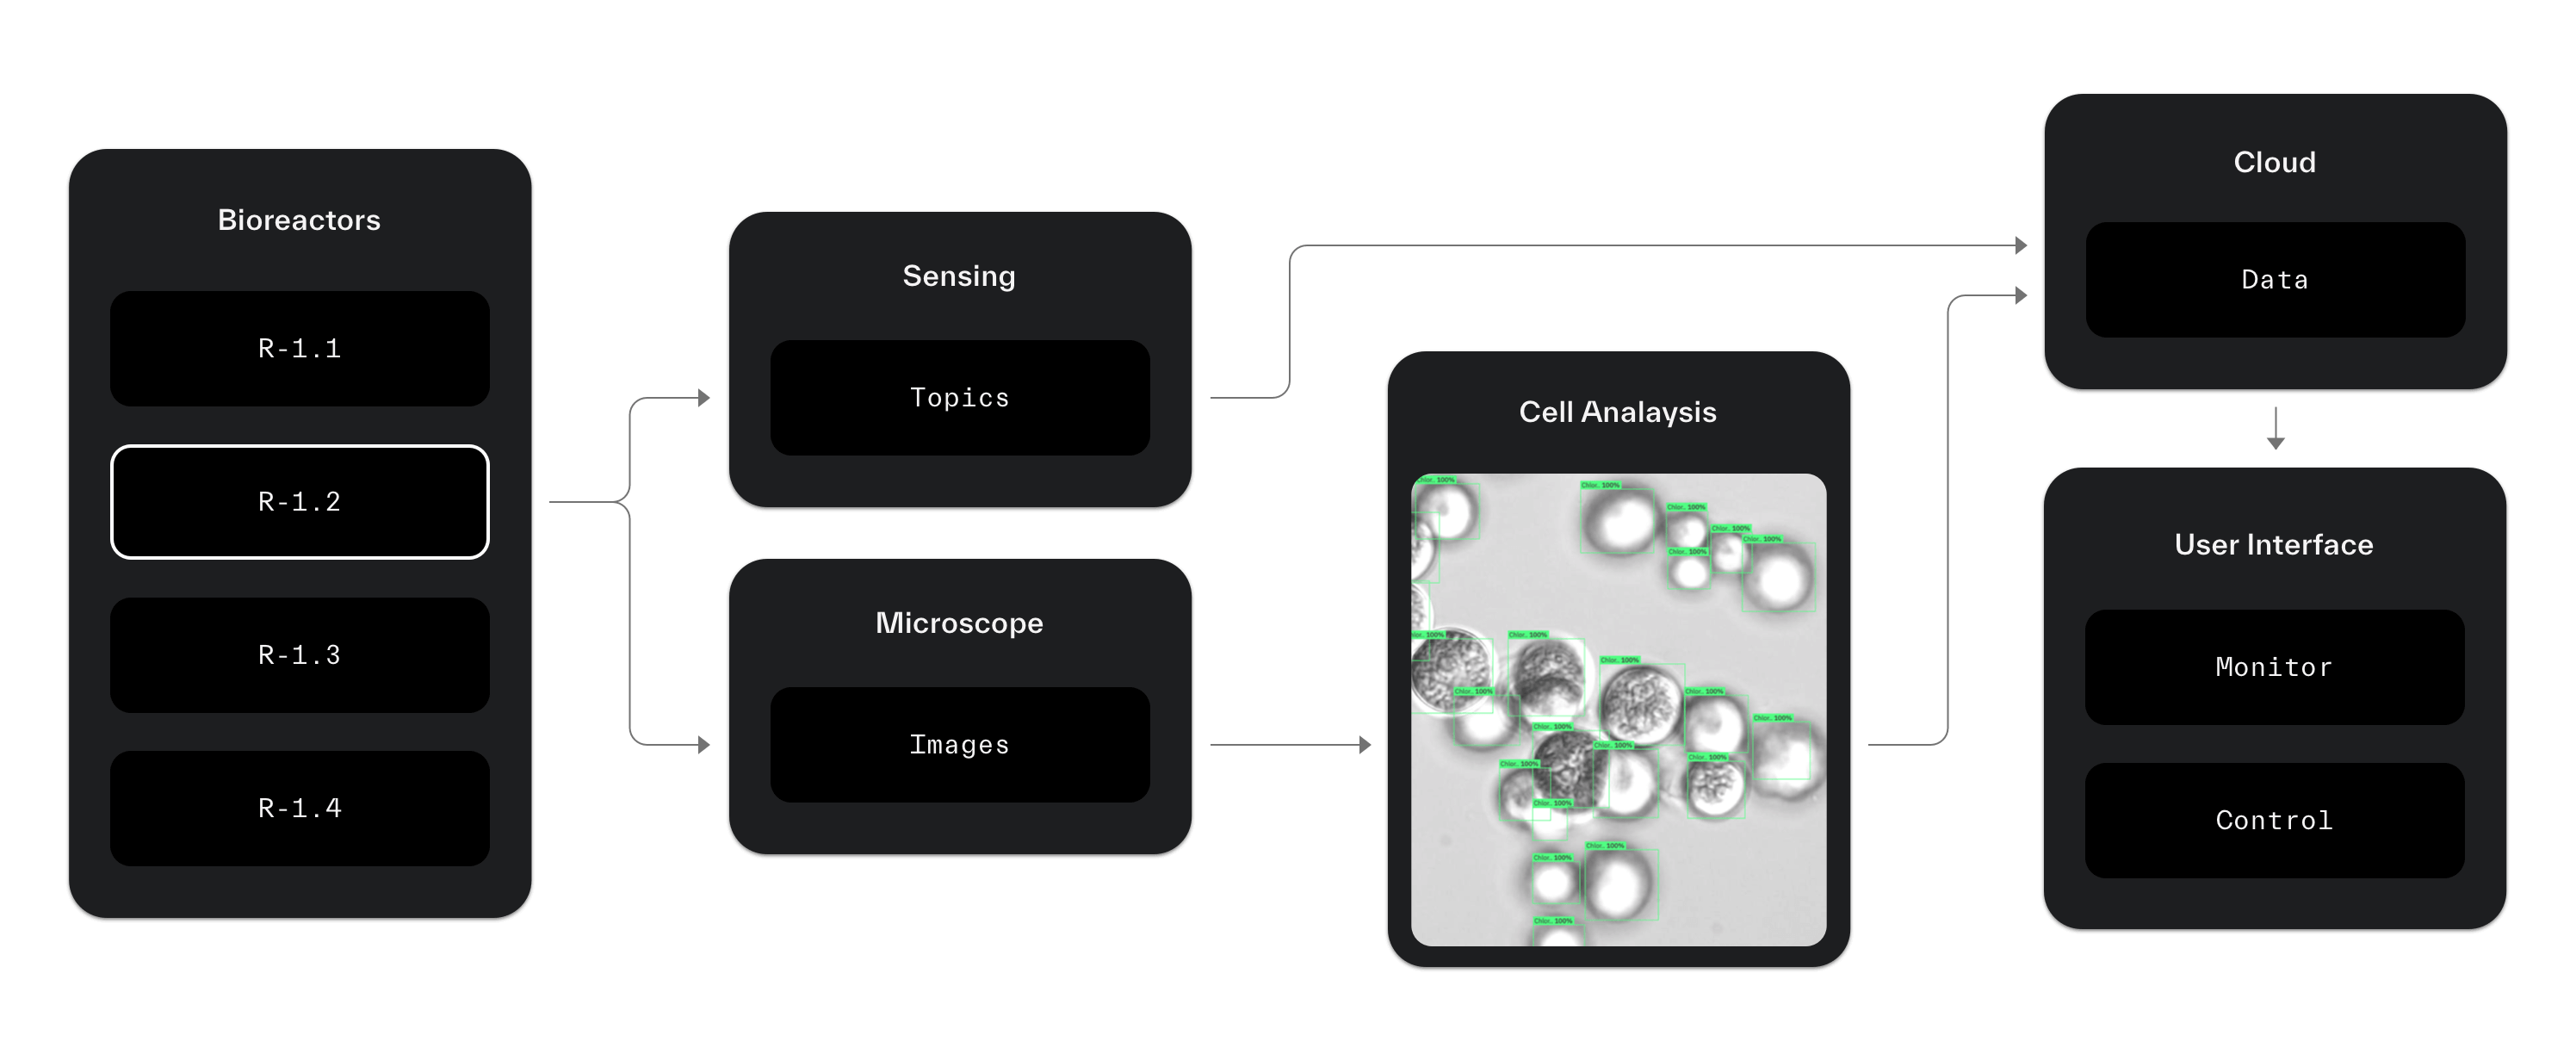
Integrations
Explored through workshopping, user interviews, and design activities. A comprehensive understanding of the lab's research requirements were defined while mapping out the system and architecture of technical integrations. As a byproduct, we collaboratively developed a new shared research methodology for the lab, while aligning on a shared terminology for the system.
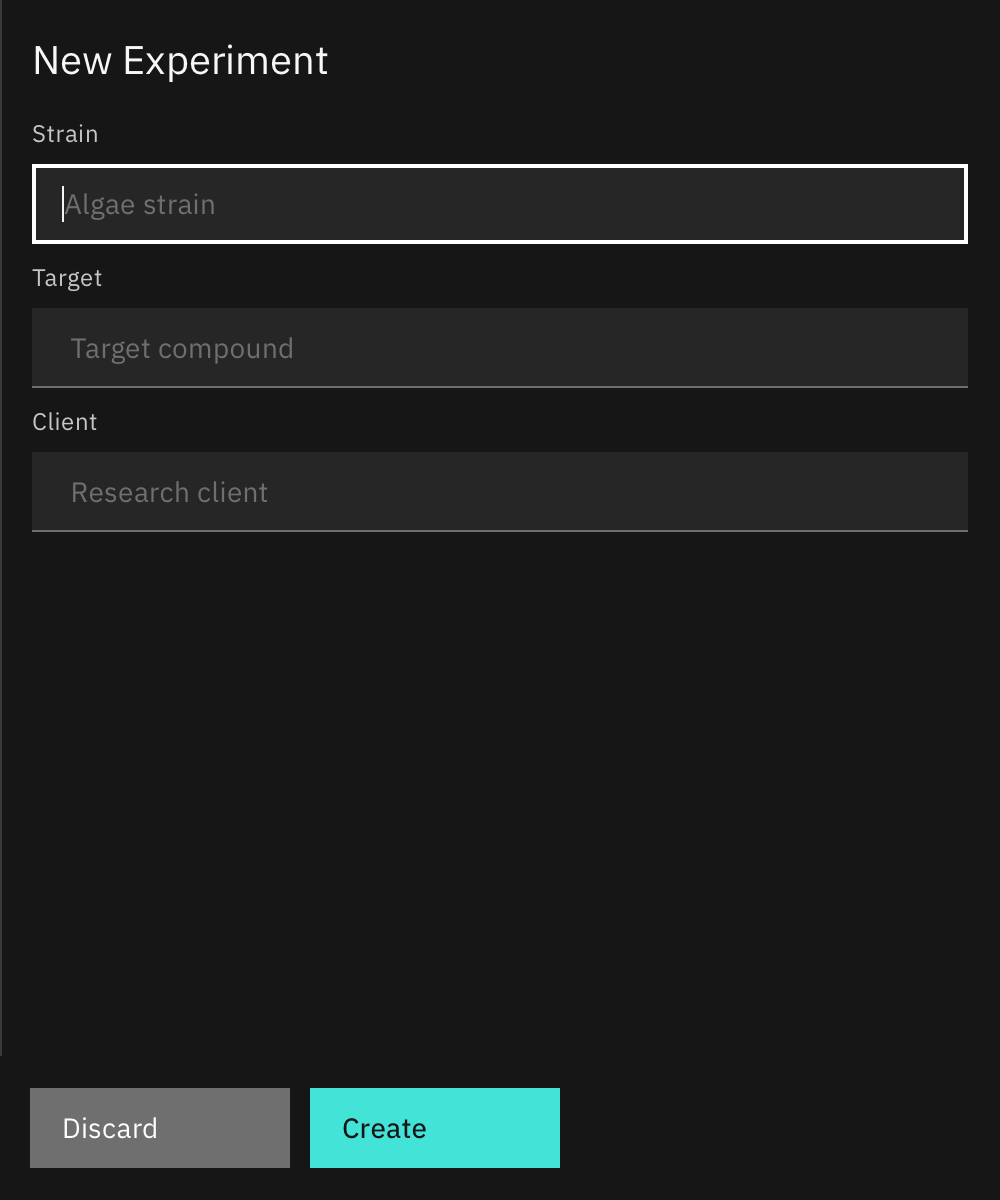
Prototyping
In collaboration with AWS, we embarked on a 6-week prototyping sprint to help develop the underlying cloud infrastructure needed for high-volume real-time data management. This was represented through a basic front-end to example fundamental functions such as: composing experiments, measuring outcomes, and running schedules.
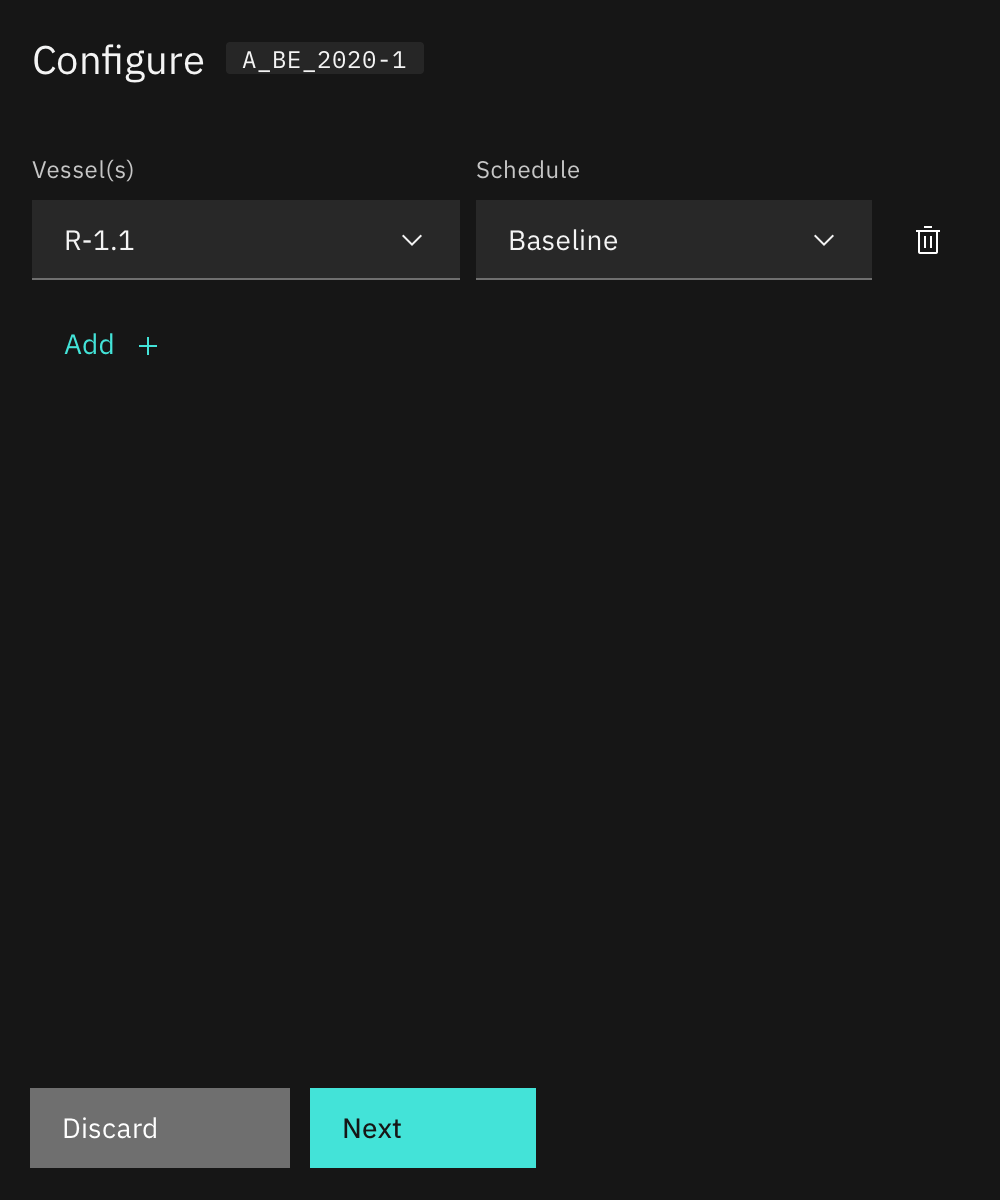
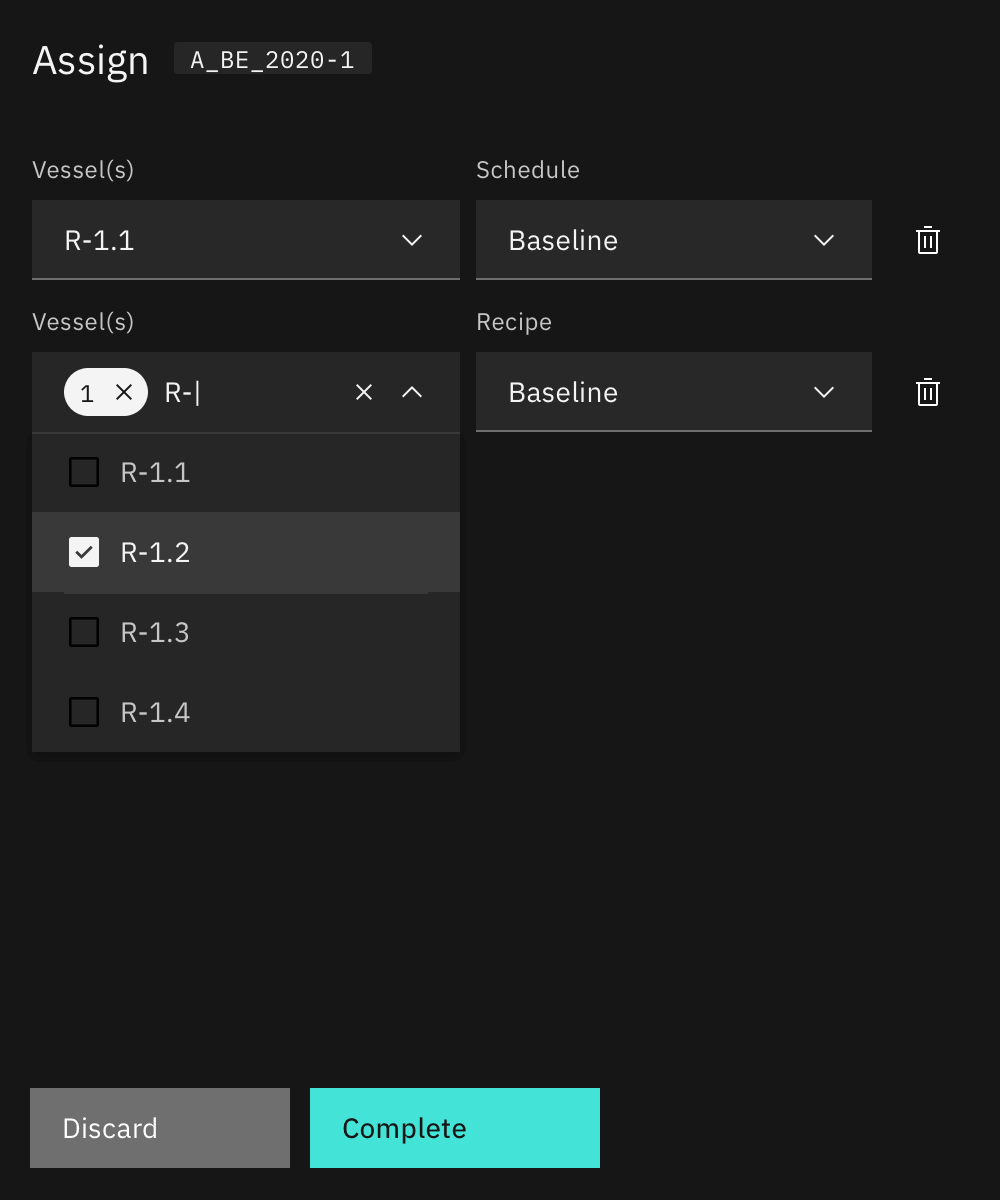
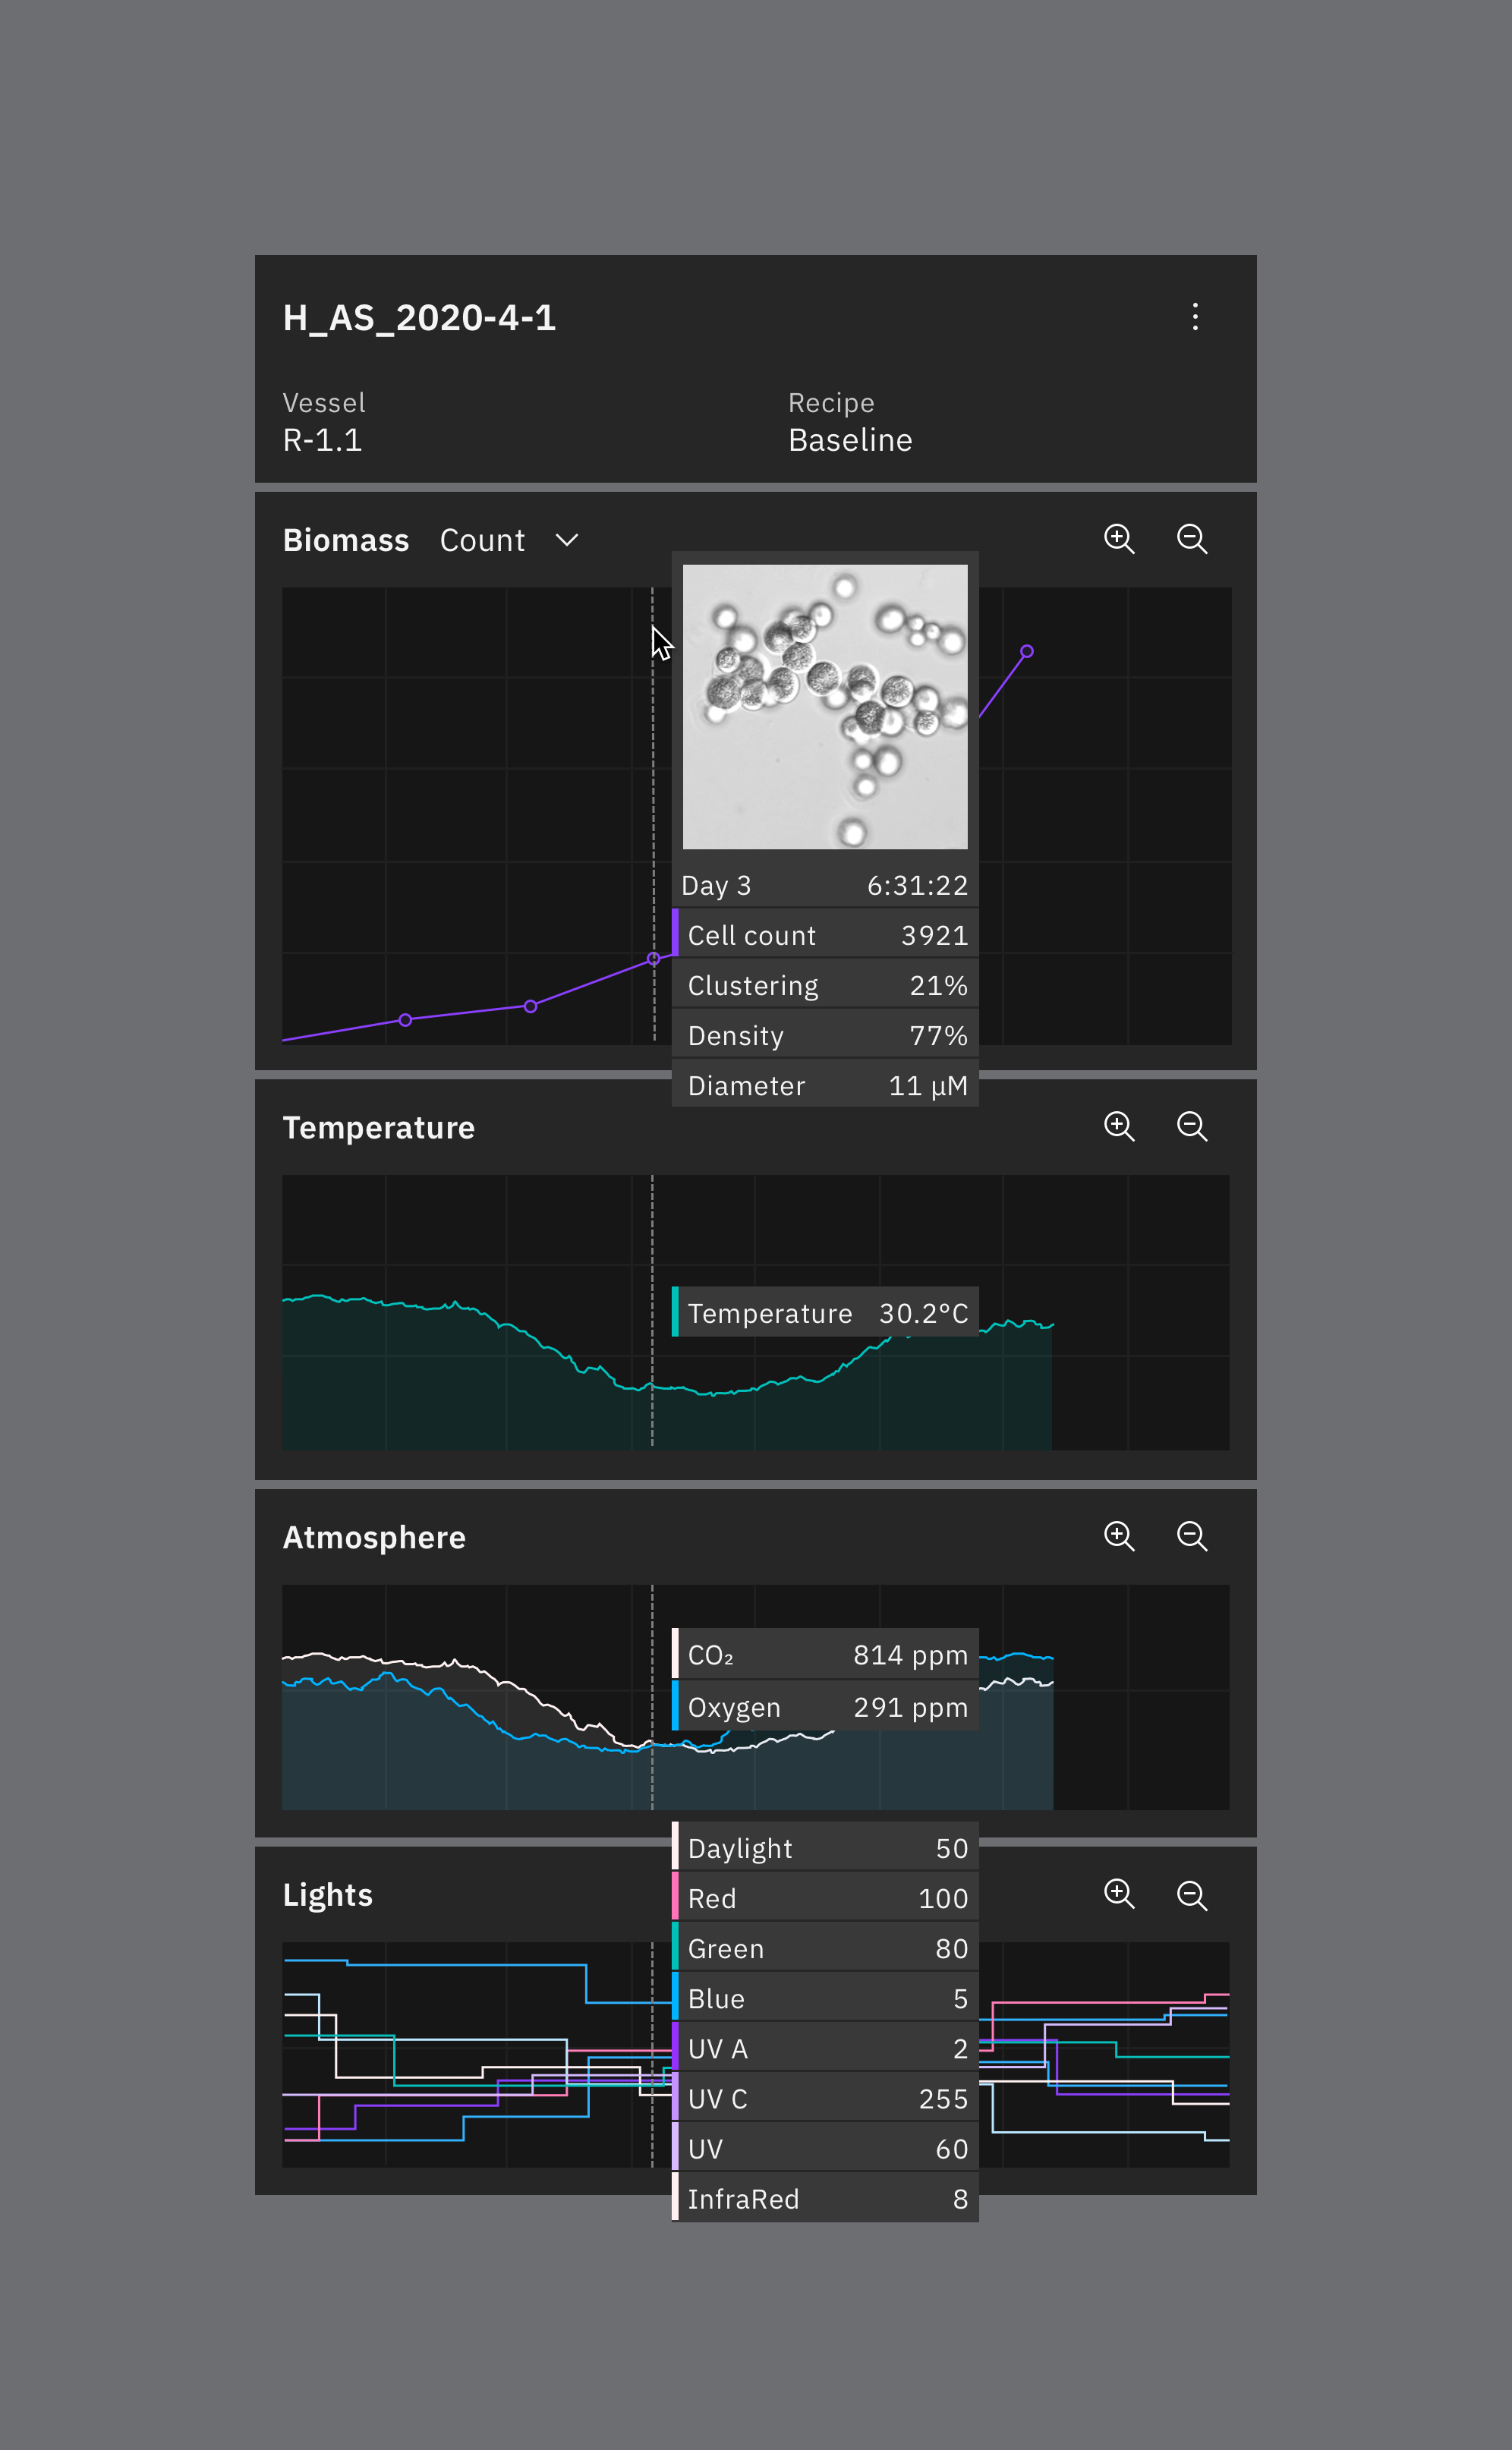
Designing Layouts. Composable table-views that use synchronised timelines to compare cross-experiment outcomes or to compare environmental growth conditions.
Charts
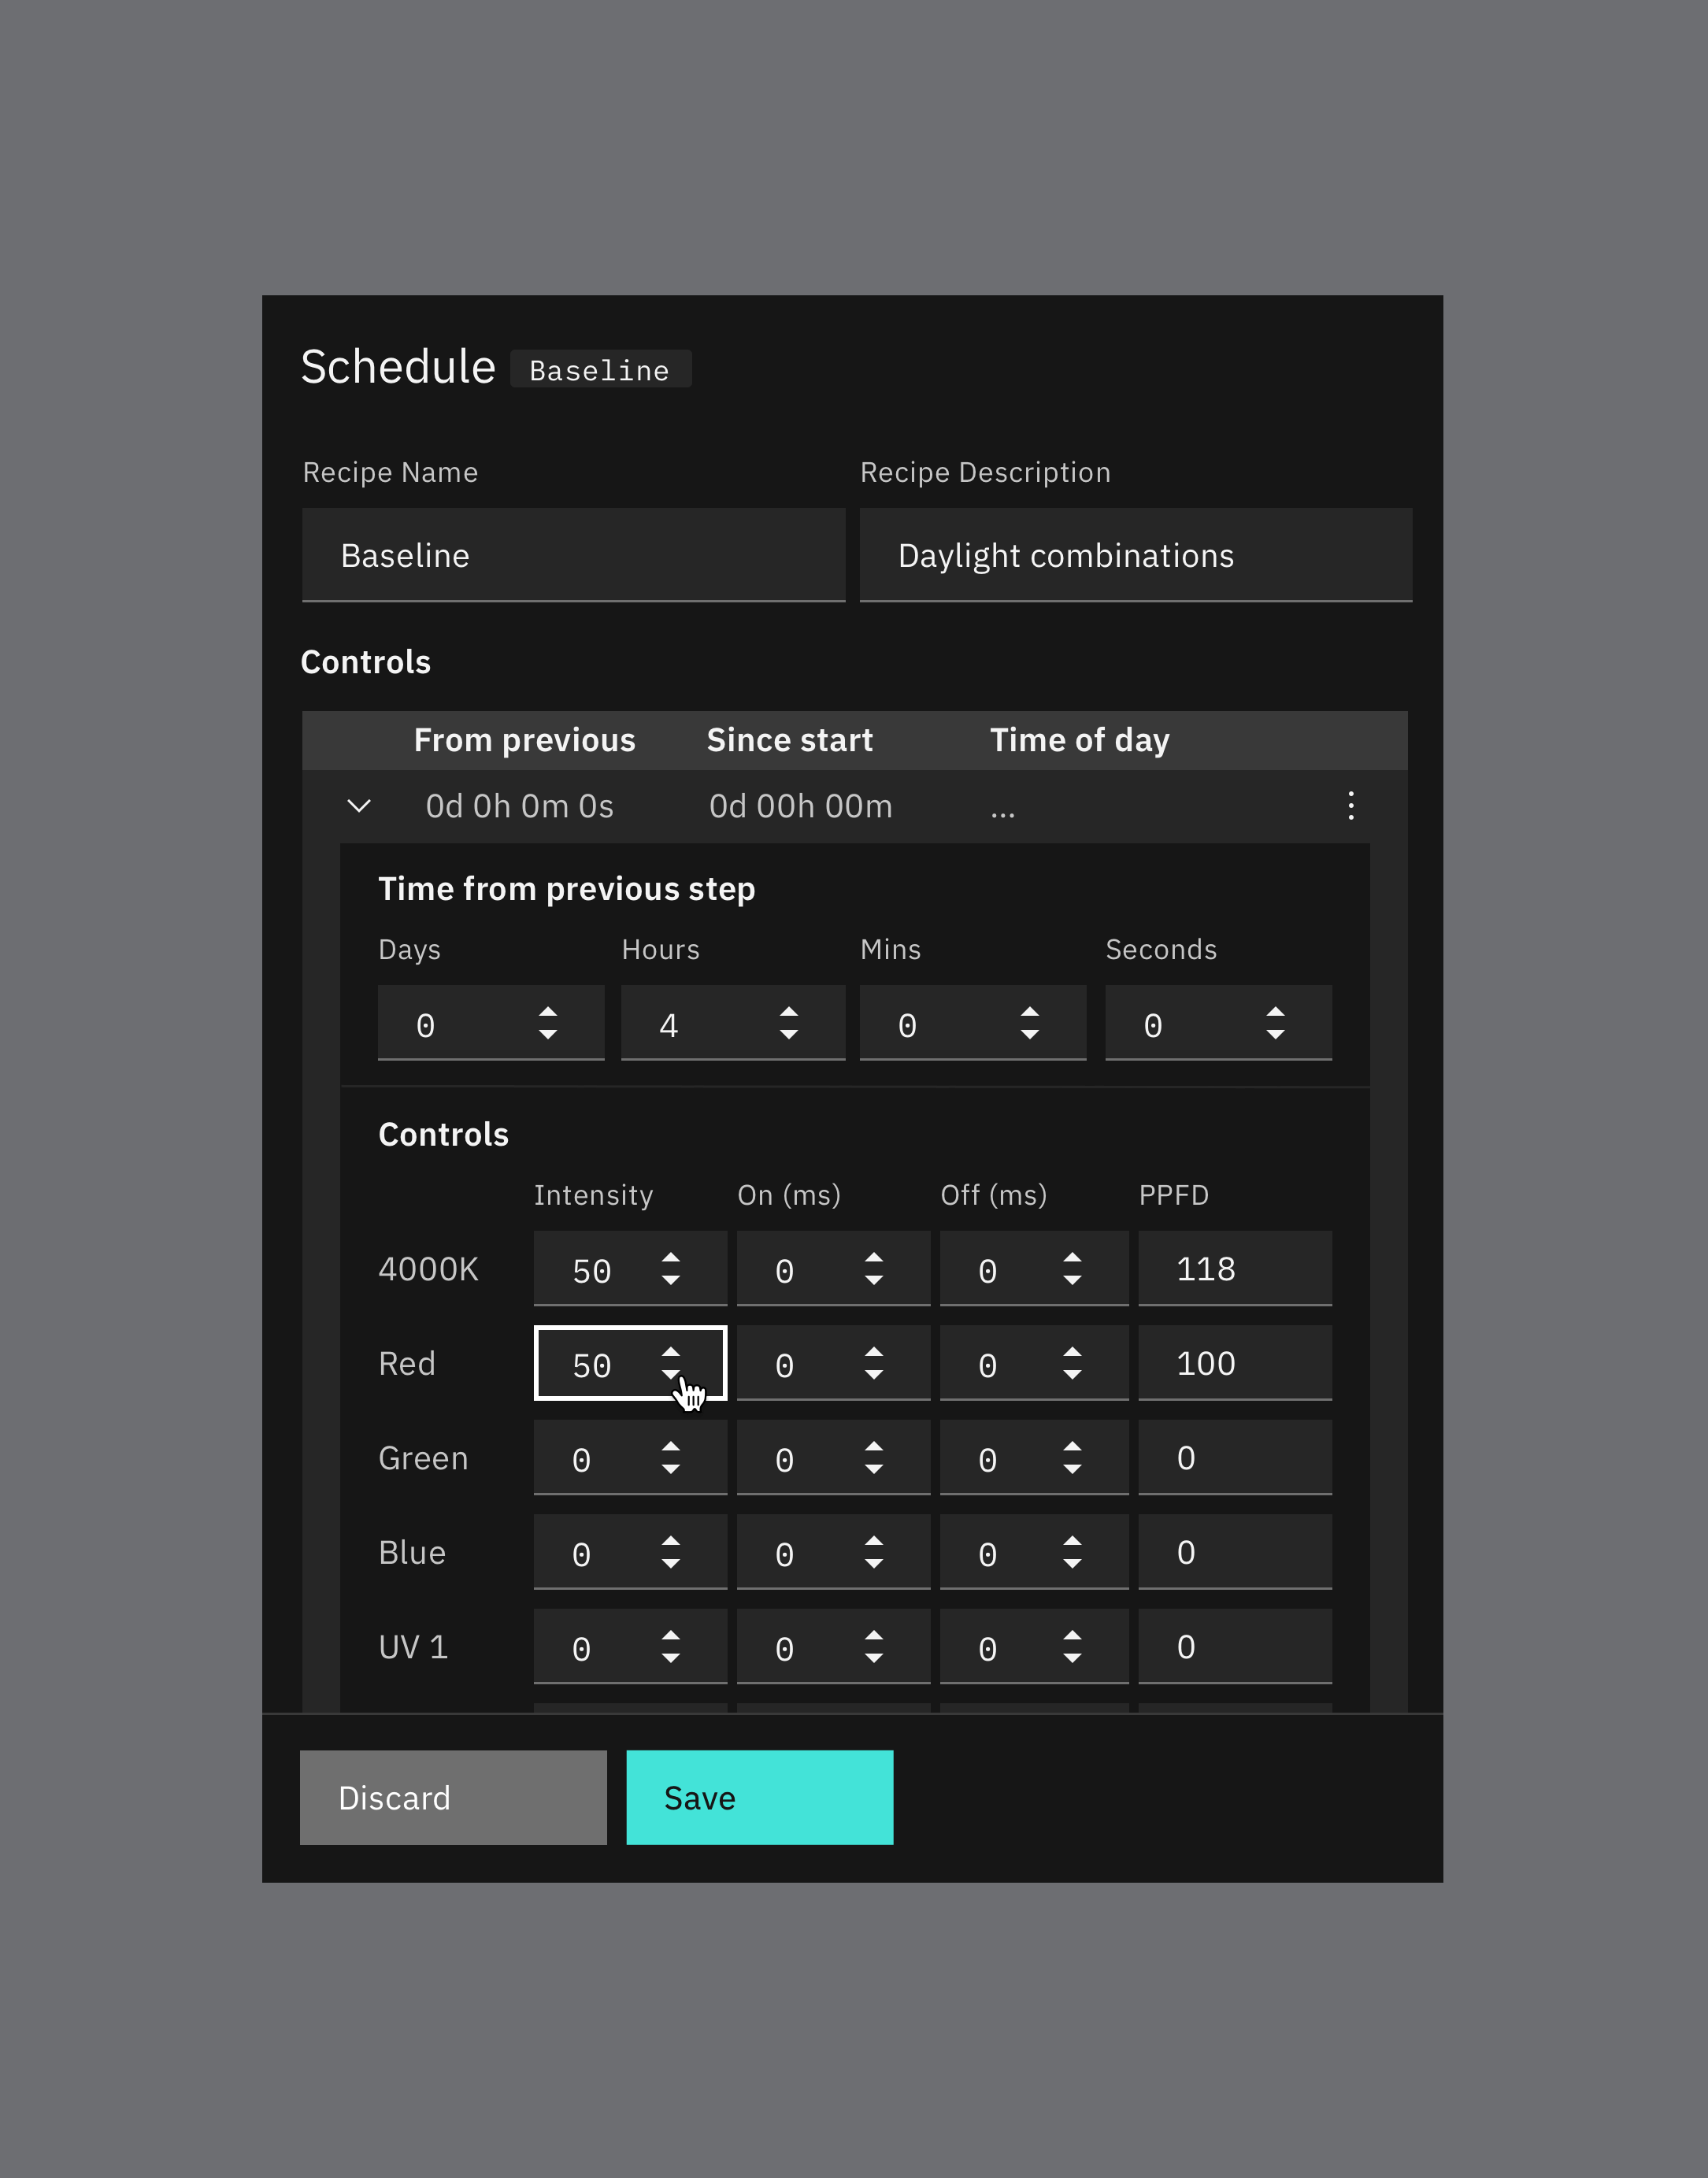
A complex visual design challenge was to display the data returned from the experiment sensors in an informative format. Each experiment needed to visualise a combination of 8 channels of light, combined with intensity, and strobe on/off time. After many iterations, the decided method was to generate a script that converted these variables into a simplified PPFD reading from a spectrometer to ensure accuracy. This allowed us to use a simple timeline chart showing 1 dataset as a combined unit.
Design System
Selecting to use IBM's open-source Carbon Design System, we were able to leverage a scalable, data-rich and highly composable pattern library. Adopting a lightly themed version unified the platform under a consistent visual language while allowing us to build new features and functionality with speed.
Process
Research is conducted over staged experiments to optimise growth conditions and enhance compound expression.
Outcome
The new platform provides the end-to-end funcationality needed to compose experiments, control and monitor conditions in the hardware remotely, and manage large-scale experiment archives.